
For every business analyst, financial expert, marketer, sales representative, or senior leader committed to have an influence on their company’s bottom line, pivot tables are now a need. Consequently, learning how to use Excel’s pivot tables and charts effectively is crucial to productivity. In Excel, how do you utilize pivot tables and charts?
Let’s start from scratch and learn how to use Excel’s pivot tables and charts.
WHAT IS PIVOT TABLE?
A PivotTable is a sophisticated tool for calculating, summarizing, and analyzing data that allows you to spot similarities, patterns, and trends.
WHAT IS THE PURPOSE OF PIVOT TABLE?
Data can be compiled and stored in a single table using the pivot table function in Microsoft Excel. This table is essential for swiftly organizing large datasets since it allows the user to see the contrasts in a very big dataset. It has movable rows, columns, data fields, and pages that let the user to instantly isolate, group, sum, and expand a specific set of data.
HOW TO CREATE A PIVOT TABLE?
Now that we are aware of what a pivot table is and the purposes for which we utilize it, let’s talk about how to make one. Following are the steps for the same.
Step 1: Select the whole table or the data you want in pivot table format.
Step 2: Insert< Pivot Table
A Dialog Box will appear, where
- If you require source data from a third party, include it in the external source space.
- Choose whether you want the Pivot Table to be in an existing or new sheet.
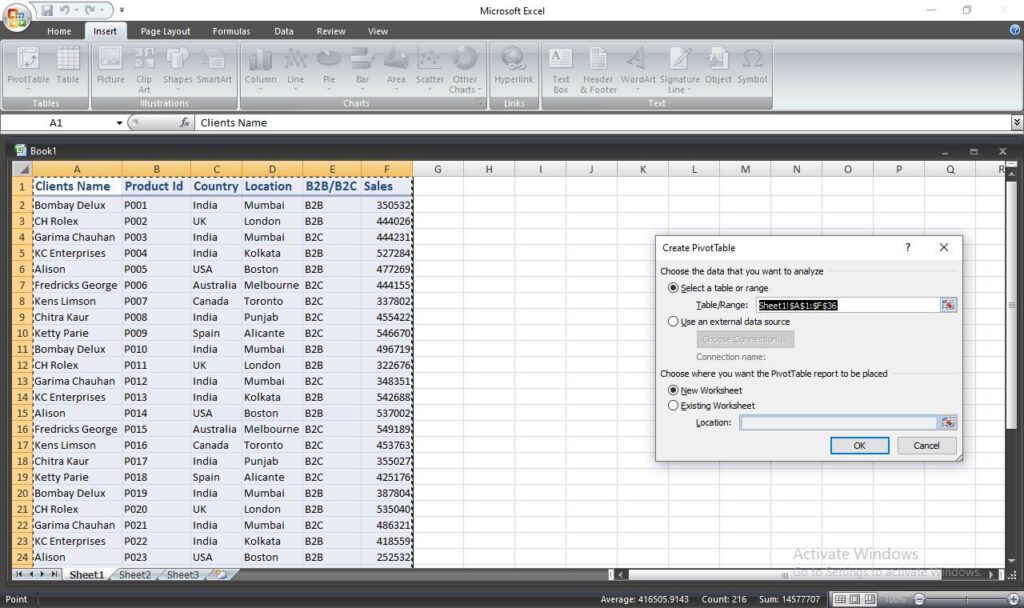
If you want the pivot table to be in an existing sheet, specify where it should be on the sheet.
Step 3: A Task Pane of Pivot Table will appear.
Drag & Drop the fields in the area section you want them to appear.
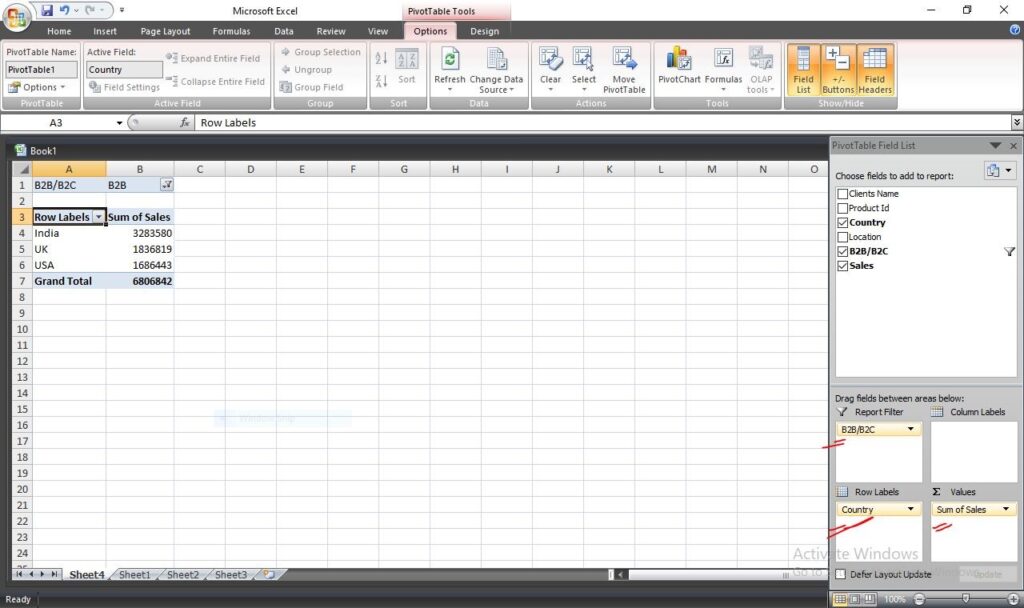
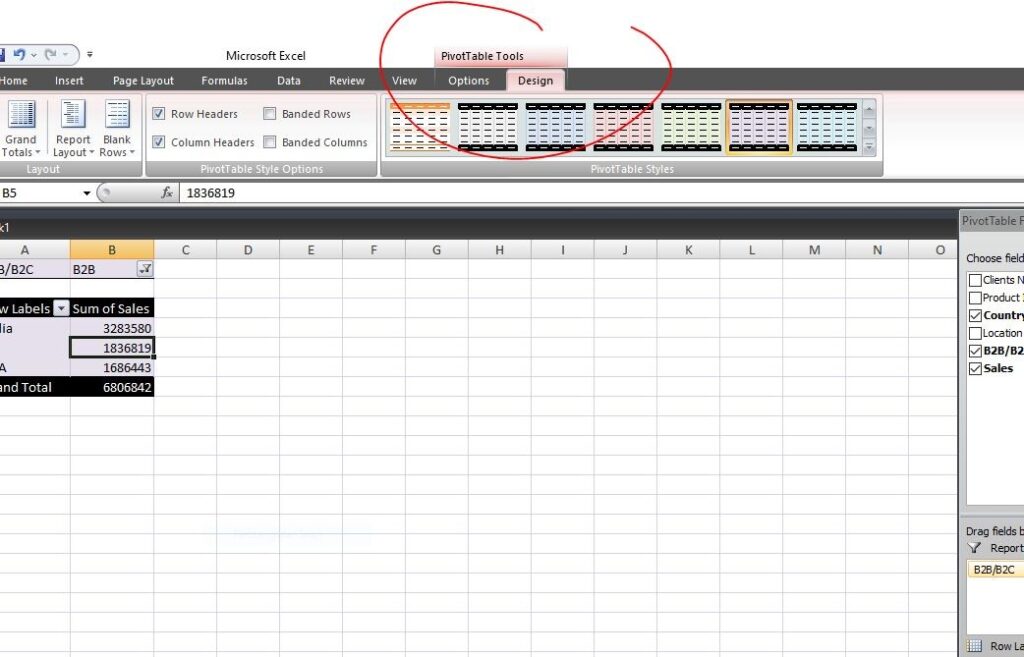
Step 4: Your Pivot Table will be created. You can format it by exploring “Design” and change the settings by exploring “Options” tabs.
Things to Remember:
- In order to make a pivot table, no columns should be merged.
- Keep your cursor over the pivot table to see the OPTIONS and DESIGN tab.
- You will even have the option of Recommended Pivot Tables right next to Pivot Tables if you have OS Window 10 or later. With this option, you will receive some pre-made pivot tables that are pertinent to your source data.
- Arrow in the right corner of the cell indicates the filters by which you can choose which data you want to see.
Advantages of Pivot Tables over Simple Data Tables
When dealing with Excel reports, pivot tables are chosen over plain data tables for some reason. Let’s examine the crucial elements that provide pivot tables an advantage over basic data tables.
- They are simple to use.
- Instant data may be produced through pivot tables.
- Data analysis is facilitated.
- Data are simply summarized in pivot tables.
- Finding data trends are made easier.
- It produces accurate reports more quickly.
- Faster decision-making can be facilitated.
WHAT IS A PIVOT CHART?
By adding visuals to the data sets in a PivotTable, Pivot Charts enhance PivotTables and make it simple to spot contrasts, patterns, and trends.
HOW TO CREATE A PIVOT CHART?
To make the data more appealing, accessible, and understandable, let’s look at how to develop pivot charts.
Step 1. Insert< Pivot Charts
Step 2: Choose the template or say, type of chart.
Step 3: A Task Pane will appear. Drag & Drop the fields in the area section. See in Fig 4
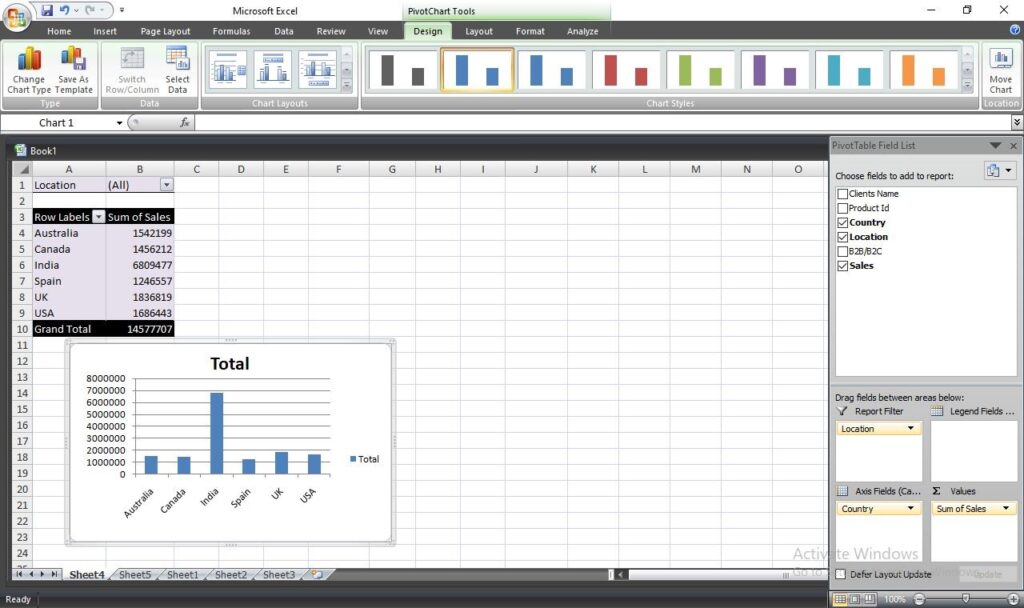
Step 4: Your chart will be created.
Explore Pivot Chart Tools like Design, Format, Layout, and Analyze to format your chart. Even more choices are available by selecting Change Chart Type from the Design tab.
If necessary, you can format data labels and legends as well.
Things to Remember:
- If you are using Windows 7, you can find the PIVOT CHARTS option in the drop-down list that appears after selecting Pivot Tables, or you can find it directly in the Options Tab.
- Keep the cursor over the Pivot Table or Table.
- If you’re using a plain data table as a reference when creating a pivot chart, you’ll be prompted to pick the position of the chart’s placement; otherwise, if you’re using a pivot table, you’ll be asked to choose a template right away.
In this article, we have discussed the fundamentals of pivot tables. Utilizing pivot tables can help you save time and effort while increasing the output of your job. Don’t forget to visit our blogs to further your knowledge as we will be discussing Pivot Tables use in Excel from beginning to advance.
Willing to learn complete Excel? Enroll into the online advance Excel course or join the offline Excel course in Delhi